

3 traders analyzing the financial markets.
U.S Dollar Strengthens;
Euro for new weekly low;
Sterling pound at few months low;
Gold loses to selling bets.
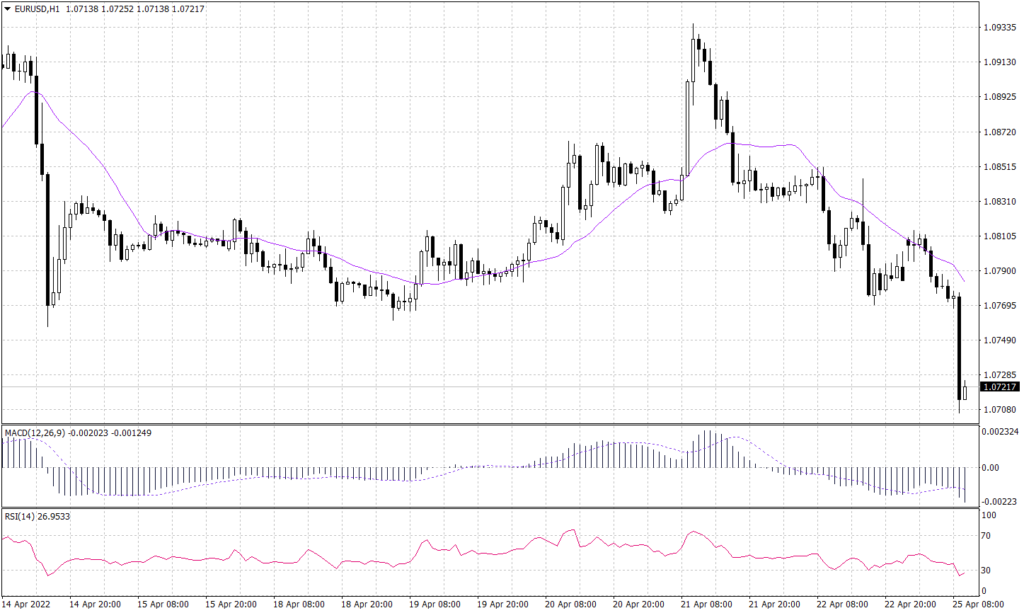
The Euro fell 0.4% to $1.0720, getting below the two-year low of $1.0758 hit last week. A look at the EURUSD daily chart shows a continuation of the bearish trend. likewise, the hourly chart supports the bearish price action, with the price currently trading at 1.0720, below the 20-candle moving average. Both the RSI and the MACD signal that the price will continue to fall.
| R1 | R2 | R3 | |
| RESISTANCE | 1.0810 | 1.0845 | 1.0870 |
| S1 | S2 | S3 | |
| SUPPORT | 1.0730 | 1.0670 | 1.0640 |
The cable fell 0.4% against the greenback below $1.2775, the lowest since September 2020. The daily time frame shows a plain bearish trend that was too sharp during the last two trading sessions.
Price is trading below the 20-period moving average on the hourly time frame, indicating a continuation of the negative trend. The RSI shows that the GBPUSD is oversold, while the MACD indicates that the price may pull back before continuing to the lower.
| R1 | R2 | R3 | |
| RESISTANCE | 1.2840 | 1.2860 | 1.2915 |
| S1 | S2 | S3 | |
| SUPPORT | 1.2750 | 1.2690 | 1.2635 |
Ethereum’s daily chart shows that the price started building slight support around 2,893 which might slow down the downward trend. The hourly chart shows a continuation of the bearish trend and reveals how weak the support built on the daily chart. Furthermore, the technical indicators RSI and MACD imply a bearish price continuance.
| R1 | R2 | R3 | |
| RESISTANCE | 2,860 | 2,890 | 3,025 |
| S1 | S2 | S3 | |
| SUPPORT | 2,800 | 2,760 | 2,715 |
WTI is testing the support of $97 for the third time since it broke above it on March 1st. Crude oil prices are affected by the supply and demand worries more than trading behavior. However, if the price broker below $97 it is likely to fall towards $93 a barrel. Nevertheless, the hourly chart shows a continuation of the bearish trend, as the price has broken below the prior low and is trading below the 20-period moving average. Technical indicators also show that the trend will be confirmed after the break below or bounce from the $97 a barrel.
| R1 | R2 | R3 | |
| RESISTANCE | 99.70 | 101.55 | 102.85 |
| S1 | S2 | S3 | |
| SUPPORT | 96.30 | 94.40 | 93.00 |
Spot gold was down 0.8% below $1,916.41 per ounce, hitting its lowest since March 29 at $1,914.58. Gold fell under selling pressure to be traded below the support level of $1,920 and turning it into resistance.
Similarly, the price is in a negative trend on the hourly time frame and trading below the 20-period moving average. Furthermore, the RSI and MACD on the hourly time signal a continuation towards $1,890.
| R1 | R2 | R3 | |
| RESISTANCE | 1,920 | 1,930 | 1,940 |
| S1 | S2 | S3 | |
| SUPPORT | 1,905 | 1,890 | 1,880 |
Are you thinking of trading with commodities in India? MCX (the Multi Commodity Exchange) is…
https://youtu.be/WxnjGRkCUW0 Monday Market Pulse: A strong start for markets! 📈 Nasdaq & S&P jump on…
Dear Valued Clients, Please be advised that the following instruments' trading hours and market session…
Think your money could work harder for you? Yes! Sounds like good news, yes? Let…
If you’re in India and considering trading US stocks, you will need to familiarize yourself…
https://www.youtube.com/watch?v=uPnwqhdmN-4 Markets kick off the week with a cautious tone! • Nasdaq 100 dips 2.1%…
This website uses cookies.


