

3 traders analyzing the financial markets.
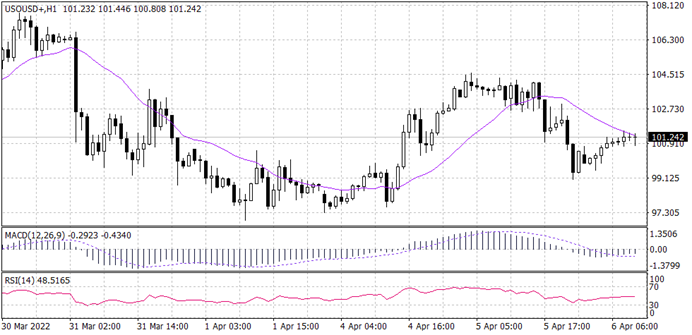
US crude oil (WTI) long-term trend is bearish. However, the price has intersected with the 20 candles MA at $101 a barrel. Fibonacci retracement shows a weak upward movement between the levels of 38.2 and 50, showing strong resistance below $102 a barrel. MACD and RSI show a likelihood of more downward movement towards $99.5 a barrel.
| S1 | S2 | S3 | |
| SUPPORT | 99.50 | 98.25 | 97.50 |
| R1 | R2 | R3 | |
| RESISTANCE | 101.50 | 102.00 | 103.20 |
GOLD spot price seems to have changed its trend to bearish after breaking the upward trend line. It has retested the 20 Period moving average resistance level, which has an intersection with the support level of $1,925. Furthermore, the RSI and MACD signal a continuation of the downward trend.
| S1 | S2 | S3 | |
| SUPPORT | 1,925 | 1,928 | 1,933 |
| R1 | R2 | R3 | |
| RESISTANCE | 1,917 | 1,914 | 1,895 |
Bitcoin’s overall trend looks to be bullish as it appears in the long-term chart. Meanwhile, the hourly time frame shows that the BTCUSD price is moving horizontally. Price is making a minor corrective move to the 20 EMA at 45,560. The MACD and RSI both signal a correction trend towards 44,600.
| S1 | S2 | S3 | |
| SUPPORT | 45,300 | 44,600 | 44,440 |
| R1 | R2 | R3 | |
| RESISTANCE | 45,430 | 45,600 | 46,000 |
From the overview of price, cable’s overall trend looks bearish. In the hourly time frame price has recently broken the previous low and is likely to make a corrective move to the retest of the 20 candles MA before continuing its bearish direction. The MACD and RSI signaling a continuation towards 1.3050.
| S1 | S2 | S3 | |
| SUPPORT | 1.3048 | 1.3000 | 1.2850 |
| R1 | R2 | R3 | |
| RESISTANCE | 1.3090 | 1.3120 | 1.3150 |
Aussie is showing a bullish trend in the long term against the greenback. however, the hourly time frame price is making minor lows to the downside. Technical indicators show a high possibility of a continuation of the bullish trend. Meanwhile, the 20 candles MA signals a slight correction towards 0.76050.
| S1 | S2 | S3 | |
| SUPPORT | 0.7560 | 0.7540 | 0.7500 |
| R1 | R2 | R3 | |
| RESISTANCE | 0.7605 | 0.7620 | 0.7640 |
EURUSD Nears Major 1.1500 level EURUSD nears the crucial level of 1.1500 as pressure on…
Tech stocks drive US indices higher Monday's session closed higher, led by tech stocks after…
The ball is now in the U.S. court after Beijing fired back raising tariffs on…
The gold rush began after a failed breakdown below the 2960 support level, which triggered…
Dear Valued Clients, Please be advised that the leverage on all US Share CFDs products…
Gold continues to trade higher for the fourth day in a row. The price of…
This website uses cookies.


